Methods
This section goes over the Methods used to generate the maps for this project.
This web page link below will take you to all the online ArcGis Maps for this project. ArcGIS Online Maps

Exploratory Regression Methods
We will be examining broad spatial correlations at a national level to find properly specified regression models. We will apply exploratory Regression to run Ordinary Least Squares (OLS) regression for every combination of candidate explanatory variable, up to the max number of variables specified to include in the model. Explanatory variables are ones with high positive or negative correlations as predictors of the dependent variable. We will use this method to analyze the 2016 election results, specifically to predict the percentage of Trump votes. We will then add additional explanatory variables (Vaccination Rates and CDC SVI Index) to explore the relationships that these control variables may have on the Democratic votes (dependent variable) in the upcoming 2024 US Presidential Election.
| Candidate Explanatory Variables | Dependent Variable | Input Feature Layer |
|---|---|---|
| 2016 Ave HH Income | Percent Republican Vote | County-Level Data Layer |
| 2016 Diversity Index | ||
| 2016 Population Density | ||
| Percent Seniors (Age 65+) | ||
| Percent Republican | ||
| Percent Blue Collar Workers | ||
| Percent Never Married | ||
| Percent College Degree |
Identify battleground counties
Since the chances of finding a properly specified model increase with more explanatory variables Let's now focus our analysis on identifying the battleground counties. We will now add a calculated field (pGOP_minus_pDEM) using the 2016 presidential vote percentages (Republican and Democratic). We added this new explanatory variables to the counties layer, plus several distance variables to perform spatial analysis and visualize the underlying trends at the county level which are associated with Trump votes in the 2016 election. This new calculated field variable is simply the difference between the percentage of Republican votes minus the percentage of Democratic votes. Below is an embedded map filtered to show only the counties where either Trump or Clinton won with less then 20% of the vote.
Geographically Weighted Regression (GWR): Percent Blue Collar Workers
We will now use Geographically Weighted Regression (GWR) at the US county level to visualize the correlation between the percentage of votes for Trump and the percentage of blue collar workers. Below is the Map Results after performing Geographic Weighted Regression (GWR) with control variable "Percent with College Degree" and dependent variable "Percent Republican vote for the 2016 Presidential Election.
Table below shows the parameters used to run the GWR
| Parameter Name | Parameter Value |
|---|---|
| Input Features | County-Level Data Layer |
| Dependent variable | Percent Republican Vote |
| Explanatory variable | Percent Blue Collar Workers |
| Output Feature Class | Map_GWR_BlueCollar |
| Kernel type | Fixed |
| Bandwidth Method | Akaike Information Criterion |
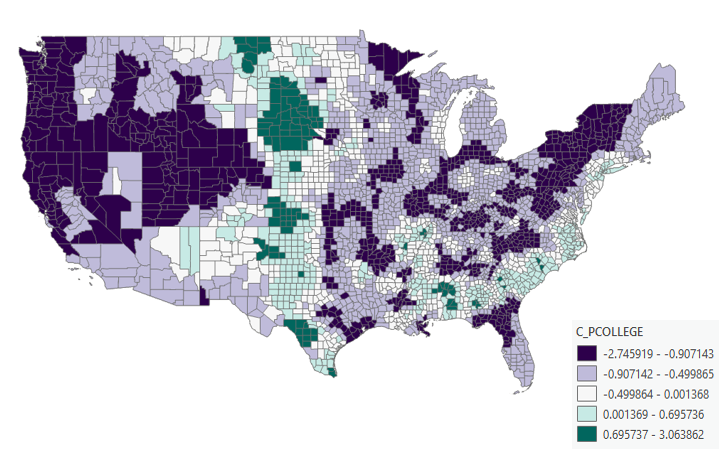
Geographically Weighted Regression (GWR): Percent College Degree
We will now use Geographically Weighted Regression (GWR) at the US county level to visualize the correlation between the percentage of votes for Trump and the percentage of people with We will now use Geographically Weighted Regression (GWR) at the US county level to visualize the correlation between the percentage of votes for Trump and the percentage of people with college degrees.
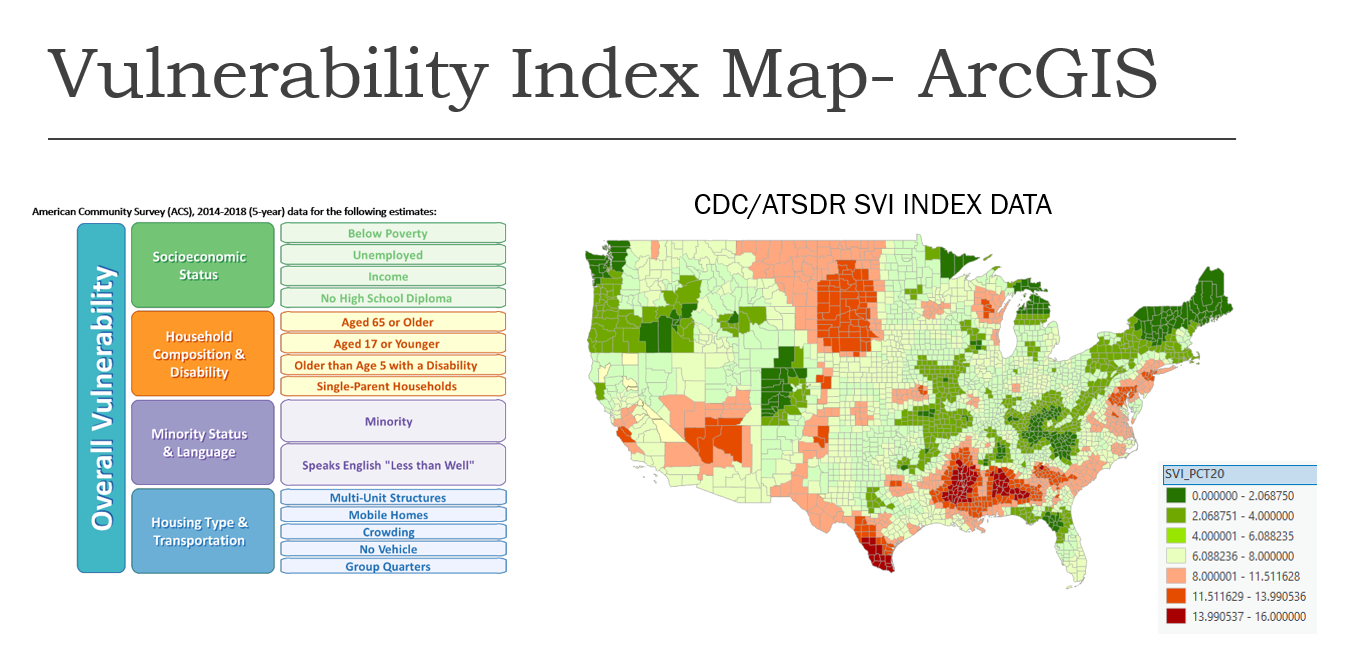
CDC Vulnerability Index (SVI)
The degree to which a community exhibits certain social conditions, such as high poverty, low percentage access to a vehicle, or crowded housholds may negatively affect a community's ability to respond to natural disasters. The SVI index was developed by the CDC, Geospatial research, analysis & services program (GRASP) to help public officials and emergency response planners identify and map the communities that are most likely to need support prior to, during, and after a natural disaster. SVI indicates the relative vulnerability of a community and groups them into four related themes. Ea track receives a ranking from 0 (least vulnerable) to 16 (most vulnerable).