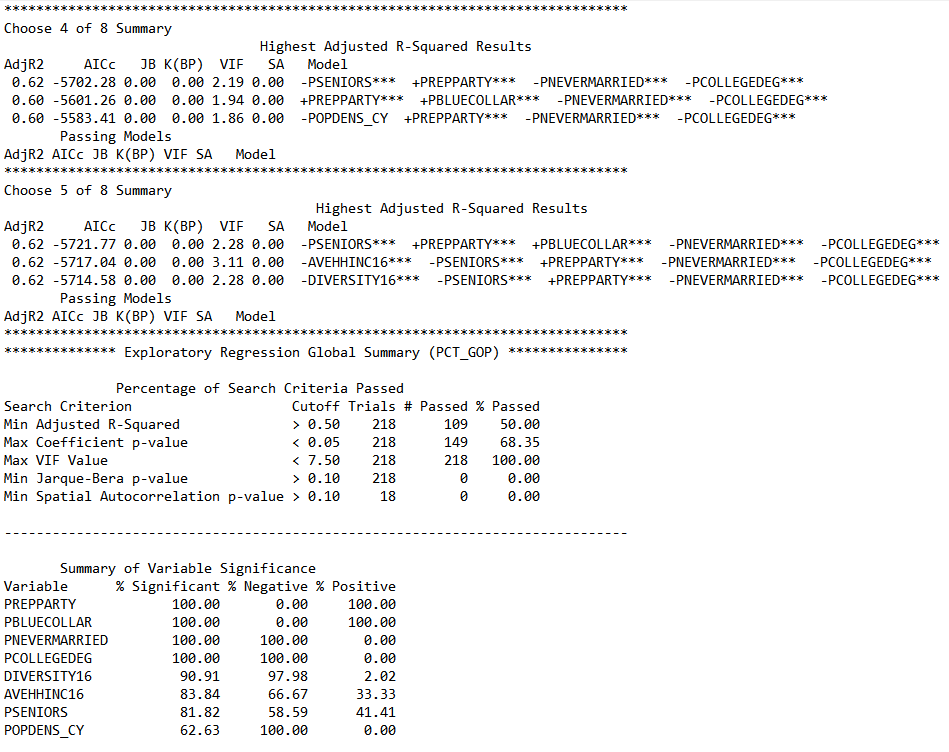
Explor Regression Report: 2016 Vote Republican
Determine which explanatory variables are consistent predictors of the 2016 US Presidential Election percentage Trump vote.
This is a partial print out of the Exploratory Regression report generated using ArcGIS.
Exploratory regression is a spatial statistics tool that evaluates all possible combinations
of the input candidate explanatory variables.
It looks for Ordinary Least Squares (OLS) models that can best explain the dependent variable within the context of user-specified criteria.
Exploratory Regression was Run with the following parameters:
Input features: CountyData_EnrichLayer Dependent Variable: PCT_GOP Candidate Explanatory Variables: 2016 Ave HH Income 2016 Diversity Index 2016 Population Density Percent Seniors (Age 65+) Percent Republican Percent Blue Collar Workers Percent Never Married Percent College Degree